| TROVIEW INTELLIGENCE | Distressed Real Estate Assets Market | Q2 2026 |
| TROVIEW INTELLIGENCE · GLOBAL INTELLIGENCE REPORT |
By Geography · By Asset Class · By Distress Category · By Capital Source
The total volume of distressed commercial real estate assets reached USD 116 billion in Q1 2025 a 31% increase from a year earlier before rising to USD 126.6 billion in Q3 2025 up 18% year-on-year, sales of distressed commercial real estate properties exceeded USD 25 billion through Q3 2025 per Forvis Mazars analysis of March 2026, the USD 957 billion in commercial real estate loans maturing in 2025 represents nearly triple the 20-year average with an estimated USD 400 billion in prior-year maturities rolled into 2025 creating a total maturing pool exceeding USD 1 trillion per Moss Adams October 2025 analysis, 2026 maturities are projected at USD 936 billion almost 19% more than 2025 with annual maturities expected to exceed USD 1 trillion through 2030 per S&P Global Market Intelligence data cited in CRE Daily, CMBS delinquency rates reached 7.29% in 2025, CRE CLO delinquency rates increased to 7% from less than 1% before the pandemic per PIMCO analysis, PIMCO estimated liquidation values have fallen 20% to 40% from their peak with core-focused transactions trading at 20% to 25% discounts to 2021 levels, office CMBS loan delinquency in the US rose to 11% per Flossbach von Storch analysis, and Hang Seng Bank's impairment charges for Hong Kong CRE loans surged 224% in H1 2025 with the bank's NPL ratio reaching 6.69% as of June 2025 confirming that the global distressed real estate assets market is in the most structurally significant distress cycle since the 2008 to 2011 global financial crisis, with the resolution, restructuring, and opportunistic acquisition of distressed assets constituting one of the largest special situations capital deployment opportunities in the institutional real estate market's recent history.
| Standard License: USD 7,500 | Enterprise License: USD 10,500 |
MARKET SYNOPSIS
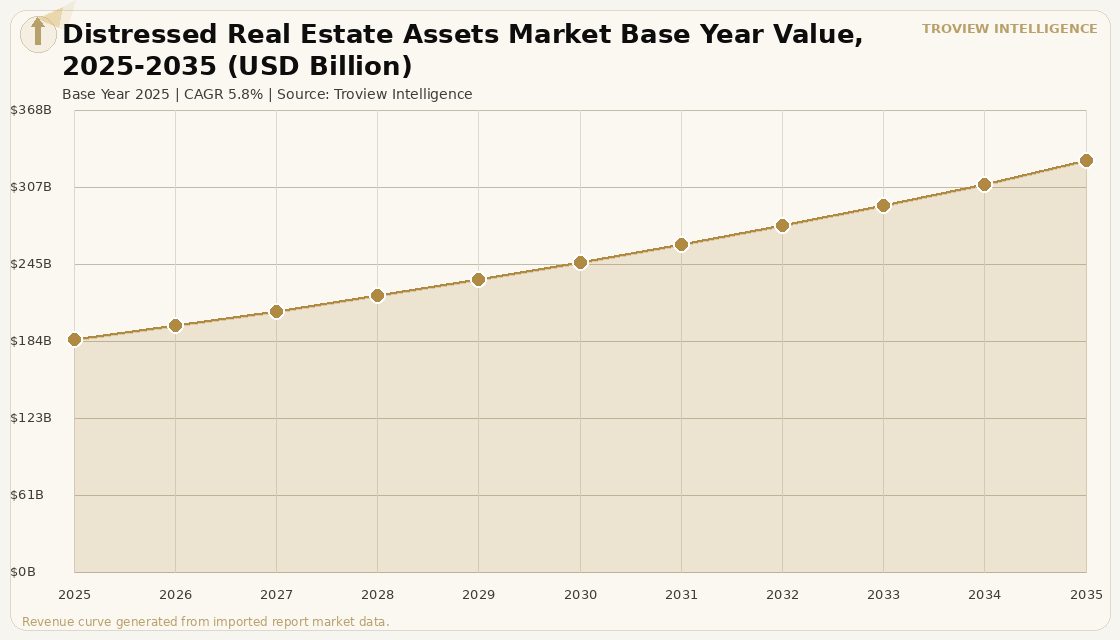
The global distressed real estate assets market size was USD 186.42 Billion in 2025 and is expected to register a revenue CAGR of 5.8% during the forecast period, reaching USD 328.64 Billion by 2035. The market encompasses the total investible and transaction-generating activity in distressed commercial real estate assets globally including non-performing loan portfolio acquisitions, real estate owned property dispositions, distressed asset direct sales and note sales, special situation real estate investment strategies, and the advisory, restructuring, and workout services markets across all property sectors and geographies where elevated debt service burdens, declining asset values, vacancy stress, or covenant breach conditions create acquisition opportunities for opportunistic and value-added capital. The 2025 market estimate is grounded in verified transaction and distress data: the total volume of distressed commercial real estate assets reached USD 116 billion in Q1 2025, a 31% increase from a year earlier per PBMares February 2026 analysis, before reaching USD 126.6 billion in Q3 2025 at 18% year-on-year growth per MMG Real Estate Advisors data; and sales of distressed commercial real estate properties exceeded USD 25 billion through Q3 2025, a 5% increase over the same period in 2024 per Forvis Mazars March 2026 analysis. Market revenue growth is anchored in the structural accumulation of CRE loan maturities that has no precedent in the modern commercial real estate finance era: an estimated USD 1 trillion-plus in commercial real estate loans matured in 2025, incorporating an estimated USD 400 billion in prior-year maturities rolled from 2023 and 2024 per Moss Adams October 2025 analysis, with 2026 maturities projected at USD 936 billion (almost 19% more than 2025) per S&P Global Market Intelligence data, and with annual CRE maturities expected to exceed USD 1 trillion through 2030 per CRE Daily analysis. Hackman Capital Partners' default on a USD 1.1 billion mortgage tied to the Radford Studio Center in Los Angeles in January 2026, in which revenue covered only approximately 21% of debt service per World Property Journal reporting, is the emblematic transaction-level illustration of the distress dynamics that characterise the current cycle at the asset level, where revenue shortfalls relative to peak-era debt service requirements are generating the forced dispositions and NPL formations that create the distressed asset acquisition pipeline. For instance, in Q1 2026, JLL confirmed that global direct transaction volume reached USD 216 billion rising 18% year-on-year with cross-border investment up 37%, driven in part by opportunistic capital targeting assets offered at distress-driven discounts confirming that the distressed asset supply pipeline is actively being absorbed by institutional special situation and opportunistic capital. These are some of the key factors driving revenue growth of the market.
PIMCO's commercial real estate outlook analysis estimated that liquidation values have hit bottom having fallen 20% to 40% from their peak, with core-focused recent transactions trading at 20% to 25% discounts to 2021 levels per PIMCO analysis, and with Class A buildings having likely bottomed out while Class B and Class C properties in sectors including office and life sciences still having room to decline per PIMCO executive vice president Seray Incoglu's assessment. The extend-and-pretend dynamic where lenders modified or extended loan terms to avoid forcing distressed dispositions has created a deferred distress pipeline that is now crowding into 2026 rather than being released in a single event, with tens of billions of CRE loans adjusted in Q3 2025 alone to delay defaults and avoid fire sales per MMG Real Estate Advisors data, and with the rolling 12-month troubled multifamily volume growing from approximately USD 1.1 billion in early 2020 to USD 6.7 billion in early 2024 and reaching a new high of USD 13.8 billion by June 2025 per MMG, confirming that the residential distress cycle is compounding the office-led commercial distress cycle simultaneously. Globally, Hong Kong's commercial real estate sector has provided an additional layer of distress supply, with Hang Seng Bank's impairment charges for CRE loans surging 224% in H1 2025, Grade A office values falling more than 50% below their peak per J.P. Morgan Private Bank Asia March 2026 analysis, and the city's aggregate Grade A office vacancy reaching 15 million square feet that will require at least seven years to absorb per CBRE reporting. These are some of the key factors driving revenue growth of the market.
However, the global distressed real estate assets market faces structural constraints that limit the resolution velocity of the distressed asset pipeline and the pace at which special situation capital can be deployed through the forecast period. The extend-and-pretend loan modification strategy that has accumulated USD 400 billion in deferred 2023 and 2024 maturities into the 2025 and 2026 refinancing wave reduces the actual rate of forced asset dispositions below what the headline distressed loan volume implies, as lenders and borrowers continue to prefer extensions and modifications over distressed sales that would crystallise losses at current market values that are significantly below original loan underwriting values. The gap between property-level income and existing debt service costs PIMCO noting that CRE CLO delinquency rates have risen from less than 1% before the pandemic to 7% reflects the severity of the operating income shortfalls at assets whose net operating income has not grown at the rates that the 2021-era debt underwriting assumed, creating a valuation reset that lenders are choosing to absorb through extended loan terms rather than immediate mark-to-market loss crystallisation. Iran-US geopolitical tensions and LNG price volatility through the Strait of Hormuz, as confirmed by IMF March 2026 analysis, affect distressed real estate assets through the energy operating cost transmission that depresses the net operating income of office, hotel, industrial, and data centre properties increasing the frequency and severity of DSCR covenant breaches that trigger distress classifications and reducing the stabilised operating income that opportunistic investors can underwrite when acquiring distressed assets. These factors substantially limit global distressed real estate assets market growth over the forecast period.
The global distressed real estate cycle of 2023 to 2028 is not a crisis in the traditional sense. In 2008 and 2009, property values fell 40% to 50% within 18 months because the source of distress was systemic financial sector leverage that created self-reinforcing selling pressure. The current cycle is structurally different. The distress is real USD 126.6 billion in distressed volume by Q3 2025, CRE CLO delinquency rates at 7%, office values 50% below peak in Hong Kong but it is highly concentrated in specific sectors, geographies, and vintage-year loan cohorts. Office is the primary distress category globally because the structural shift in space demand from hybrid work has created a supply overhang that no interest rate cycle can solve. The other sectors industrial, residential, data centre, hotels are performing at or above their pre-distress-cycle fundamentals in most markets. The distressed asset opportunity is therefore sector-specific and requires underwriting discipline that distinguishes the genuinely impaired assets from the temporarily over-leveraged assets that are simply waiting for refinancing conditions to normalise. Patient capital that can underwrite to current operating income rather than peak-year projections will generate the most compelling risk-adjusted returns in the 2026 to 2030 resolution window." Troview Intelligence Head of Global Distressed Real Estate Assets Research
SEGMENT INSIGHTS
Four Regions Defining Global Distressed Real Estate Asset Resolution
NORTH AMERICA USD 1T+ MATURITIES 2025, CMBS 7.29%, USD 126.6B Q3 DISTRESSED VOLUME
| Total Distressed CRE Volume Q3 2025 | CRE Loan Maturities 2025 | CMBS Delinquency 2025 | Office CMBS Delinquency |
| USD 126.6 Billion (+18% YoY) MMG Real Estate | USD 957B+ (triple 20-year average; USD 400B rolled from prior) | 7.29% nearly 6x higher than traditional bank loans | 11% record levels per Flossbach von Storch |
North America's distressed commercial real estate market is the largest and most liquid in the world, anchored by the United States' USD 957 billion in CRE loan maturities in 2025 representing nearly triple the 20-year average with an additional estimated USD 400 billion in prior-year maturities rolled into 2025, creating a total maturing CRE loan pool exceeding USD 1 trillion per Moss Adams October 2025 analysis. The CMBS delinquency rate reaching 7.29% nearly six times higher than traditional bank delinquency rates confirms that the securitised CRE debt market is carrying the most concentrated distress signal in the current cycle, with office CMBS delinquency reaching 11% per Flossbach von Storch January 2025 analysis as the sector most severely impacted by hybrid work adoption-driven demand destruction. Sales of distressed commercial real estate properties exceeded USD 25 billion through Q3 2025 per Forvis Mazars, transaction volume was up approximately 25% year-on-year in that period, and pricing was up approximately 14% from Q3 2024 to Q3 2025, confirming that the distressed market is clearing at improving prices even as the distressed pipeline continues to grow. Private equity is sitting on significant dry powder targeting distressed CRE opportunities per Forvis Mazars, with funds specifically structured for distressed real estate acquisition positioned to absorb the distressed asset sales that the USD 936 billion 2026 maturity wall will generate.
| European RE Debt Funding Gap | ECB Rate Cutting | European Office Distress | Interest Rates Context |
| EUR 86 Billion (Natixis/AEW Research, Nov 2024) | June 2024 cycle initiated CBRE 2.15% Eurozone by year-end | Values still declining in secondary and tertiary office markets | Negative/near-zero 2009-2022 adjustment sharper per PIMCO |
Europe's distressed real estate market reflects the structural adjustment from the 2009 to 2022 period of negative or near-zero interest rates to the post-2022 elevated rate environment, with PIMCO noting that in Europe, unlike in the US, interest rates were negative or close to zero from 2009 to 2022 and most market players got used to this making the adjustment to above-zero rates structurally more impactful on European real estate valuations than equivalent rate increases in the US where positive rates were already the norm. The European real estate debt funding gap was estimated at EUR 86 billion by Natixis Investment Managers and AEW Research as of November 2024, representing the estimated shortfall between maturing European real estate debt and available refinancing capital, with the gap specifically concentrated in secondary and tertiary office assets and retail properties where debt refinancing at current market values and elevated interest rates generates equity shortfalls that force distressed dispositions. The ECB's June 2024 rate cutting cycle and the forecast of Eurozone policy rates falling to 2.15% by year-end 2025 per CBRE provides the monetary policy trajectory that European distressed real estate investors are underwriting as the mechanism through which stabilised financing costs will gradually restore bid-ask spreads in distressed European office and retail markets.
| Hang Seng NPL Ratio June 2025 | HK Grade A Office Values | HK Grade A Office Vacancy 2025 | HK Aggregate Office Vacant Space |
| 6.69% (from 1.04% Dec 2021) 6x increase | More than 50% below peak (J.P. Morgan Private Bank Asia) | 17.5% citywide (J.P. Morgan) | 15 million sqft 7+ years to absorb (CBRE) |
Asia Pacific's distressed real estate market is bifurcated between China's legacy developer distress where the Evergrande restructuring and the broader Chinese property developer sector's three-red-lines-policy-driven NPL accumulation has created the largest distressed real estate debt workout in financial market history and Hong Kong's commercial real estate sector that has experienced a six-year correction since late 2019 per JLL December 2025 analysis, with Hang Seng Bank's NPL ratio rising from 1.04% in December 2021 to 6.69% as of June 30, 2025 per its 1H25 financial statements, and Hang Seng's impairment charges for CRE loans surging 224% in H1 2025 per Ainvest analysis. Hong Kong's Grade A office sector is the most structurally distressed major commercial real estate market in Asia Pacific, with values more than 50% below their peak per J.P. Morgan Private Bank Asia analysis of March 2026, citywide Grade A vacancy at 17.5% in 2025, and CBRE's March 2026 report confirming that aggregate Grade A office vacancy of approximately 15 million square feet will require at least seven years to absorb at current absorption rates.
MAJOR COMPANIES
STRATEGIC DEVELOPMENTS
Ordered 2026 first. All developments sourced from Forvis Mazars, PBMares, MMG Real Estate Advisors, Moss Adams, PIMCO, ION Analytics Debtwire, J.P. Morgan Private Bank Asia, and verified trade press.