| TROVIEW INTELLIGENCE | Global Real Estate Investment Trust Market | Q2 2026 |
| TROVIEW INTELLIGENCE · GLOBAL INTELLIGENCE REPORT |
By Geography · By Property Sector · By REIT Structure · By Market Capitalization
A total of 1,021 listed REITs with a combined equity market capitalization of approximately USD 2.04 trillion operated around the world as of 2024 per Nareit, the FTSE EPRA Nareit Global Real Estate Index Series included 497 constituents across 38 countries with a total equity market capitalization of more than USD 2.5 trillion as of November 2024, EPRA's Q2 2025 Total Markets Table confirmed the global listed real estate sector at USD 3.3 trillion representing 8.8% of total commercial real estate valued at USD 38.1 trillion globally, China officially established REITs in 2021 and had 58 listed REITs in 2024 up from 29 the prior year with India seeing 68% market cap growth since 2020, the Americas region outperformed Europe and Asia in 2024 while Asia returned 30% and Europe 21% against the US market's 3% in 2025 per the FTSE Nareit Q4 2025 review webinar, healthcare and data centres were the two best-performing global sectors in 2024, 170 million Americans representing approximately 50% of the US population live in households invested in REITs, public listed REITs paid approximately USD 66.2 billion in dividends with public non-listed REITs paying approximately USD 4.3 billion per Nareit May 2025 fact sheet, and US REITs supported an estimated 3.6 million jobs and USD 283 billion in labour income in 2024 confirming that the global REIT market is the world's most liquid and institutionally deep vehicle for income-producing real estate investment at scale.
| Standard License: USD 7,500 | Enterprise License: USD 10,500 |
MARKET SYNOPSIS
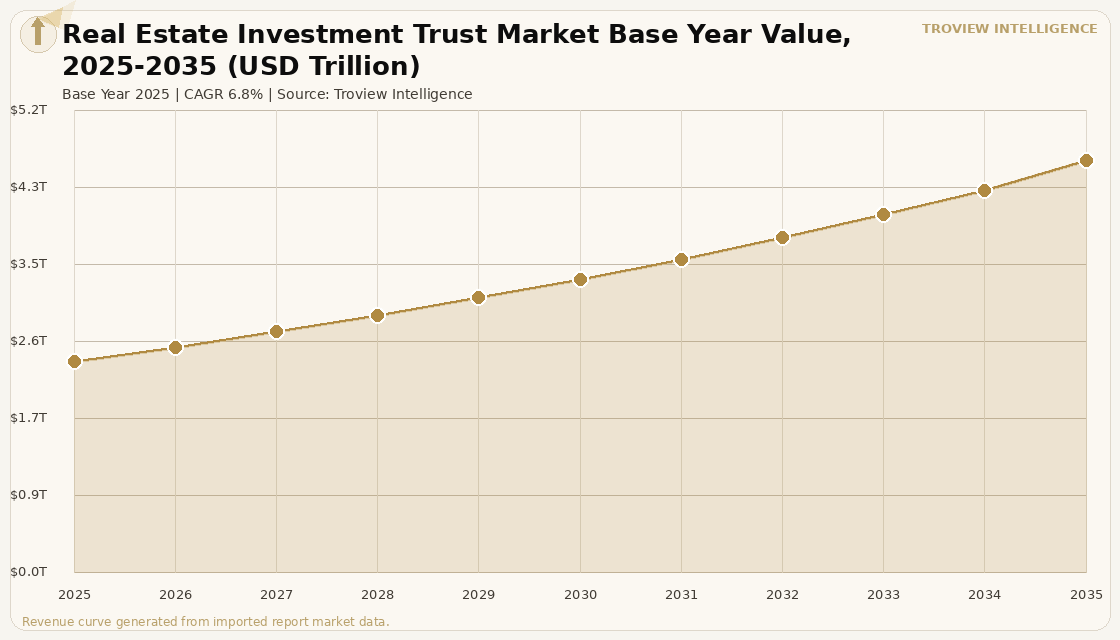
The global real estate investment trust market size was USD 2.38 Trillion in 2025 and is expected to register a revenue CAGR of 6.8% during the forecast period, reaching USD 4.64 Trillion by 2035. The 2025 market estimate is grounded in verified institutional data: a total of 1,021 listed REITs with a combined equity market capitalisation of approximately USD 2.04 trillion were in operation around the world as of 2024 per Nareit global REIT investment data; the FTSE EPRA Nareit Global Real Estate Index Series included 497 constituents across 38 countries with a total equity market capitalisation of more than USD 2.5 trillion as of November 30, 2024; and EPRA's Q2 2025 Total Markets Table confirmed the global estimated commercial real estate value at USD 38.1 trillion with the total listed real estate sector at USD 3.3 trillion representing 8.8% of total CRE and the full index market cap at USD 2.4 trillion. The market encompasses the total equity market capitalisation and investible value of publicly listed equity REITs, publicly registered non-listed REITs, and private REIT vehicles across all 40-plus countries that have established REIT legislation, spanning all property sectors from data centres and telecommunications towers through senior housing, industrial logistics, retail, office, residential, and diversified portfolios. Market revenue growth is anchored in the structural broadening of the global REIT universe across new countries and new property sectors, with China officially establishing REITs in 2021 and reaching 58 listed REITs in 2024 double the prior year's 29 and Europe and Asia each growing their REIT market capitalisations by 39% and 36% respectively since 2020 per Nareit global analysis. For instance, Canadian publicly traded REITs raised approximately CAD 5.10 billion in 2024 via capital offerings, a 25.2% increase from the prior year, demonstrating the depth of institutional appetite for REIT capital market transactions in the North American market per Verified Market Reports REIT industry analysis, with the offering volume confirming that REIT equity capital markets remained constructively open through the elevated interest rate environment that characterised 2023 and 2024. These are some of the key factors driving revenue growth of the market.
The FTSE Nareit Q4 2025 review webinar highlighted that in 2025 Asia returned 30% and Europe 21% against the US market's 3%, with Nareit EVP John Worth noting that 2025 made the case for why investors need a global portfolio as the year showed the real value of diversification over geography, and that some of the outperformance was driven by the dollar's decline and exchange rates per Nareit reporting of January 21 2026. Healthcare REITs and data centre REITs were the two best-performing global sectors in 2024, with healthcare maintaining 19% of actively managed REIT fund assets under management and data centres rebounding to 134% of their index weight in actively managed funds in Q4 2025 per Nareit's Q4 2025 actively managed US real estate fund tracker, reflecting the long-term structural conviction in data centre REITs as the primary real estate vehicle for AI infrastructure investment even after data centre total returns of negative 14% in the full year 2025 following two years of massive outperformance. Nareit's May 2025 fact sheet confirmed that public listed REITs paid approximately USD 66.2 billion in dividends and public non-listed REITs paid approximately USD 4.3 billion, with 78% of annual REIT dividends qualifying as ordinary taxable income, 12% as return of capital, and 9% as long-term capital gains in 2024, establishing REITs as the globally dominant income-producing real estate investment vehicle for institutional and retail investors seeking predictable distribution income. These are some of the key factors driving revenue growth of the market.
However, the global REIT market faces structural constraints that temper the pace of market capitalisation growth and new REIT formation across the forecast period. The USD 150.9 billion commercial mortgage-backed securities maturity wall scheduled for 2025 poses risk for highly leveraged REITs whose refinancing costs at elevated interest rates significantly exceed the rates embedded in the original CMBS underwriting, with CBRE Investment Management's North America Real Estate Outlook 2025 noting that the CMBS maturity wall offers well-capitalised REITs discounted buying opportunities while creating distress for weaker balance sheet peers. Office REITs face a structural demand headwind from the post-pandemic hybrid work model adoption, with the aggregate market cap of US office REITs having more than halved between 2019 and 2023 per NAREIT office sector data and JLL Q4 2025 US Office Capital Markets Report, and office REITs trading at a discount to net asset value with an average market price 25% below the net value of their assets as of February 2024, while data centre REITs were the only segment trading at a premium to NAV in that period. Iran-US geopolitical tensions and LNG price volatility through the Strait of Hormuz, as confirmed by IMF March 2026 analysis, affect REIT operating income through the energy cost exposure of 24-hour data centre operations, healthcare facilities, industrial logistics buildings, and retail centres whose continuous power requirements generate above-average energy consumption directly exposed to electricity price movements that follow natural gas and LNG benchmark pricing. These factors substantially limit global real estate investment trust market growth over the forecast period.
The global REIT market is not one market. It is forty markets at forty different stages of maturity, in forty different regulatory regimes, exposed to forty different macroeconomic and demographic cycles. The US REIT market, which pioneered the structure in 1960 and dominates global listed real estate equity, has spent the last decade systematically exiting the diversified REIT model and specialising into data centres, cell towers, self-storage, healthcare, and industrial logistics asset classes that generate the NOI growth rates that specialised operating platforms can extract more efficiently than diversified portfolios. The rest of the world is fifteen years behind that specialisation curve. China had 29 listed REITs in 2023 and 58 in 2024. India's market cap grew 68% since 2020. Europe grew 39%. The REIT structure is spreading globally because it solves a problem that no other financial structure solves as efficiently: it gives retail investors liquid access to large-scale, income-producing real estate at institutional pricing and without the capital intensity of direct ownership. The USD 2.38 trillion current market cap is approximately 6.3% of the USD 38.1 trillion global commercial real estate value. When that ratio converges toward the US standard over the next decade, the mathematical upside is substantial." Troview Intelligence Head of Global Real Estate Investment Trust Research
SEGMENT INSIGHTS
Four Regions Defining Global REIT Market Development
NORTH AMERICA USD 1.3T LISTED RE, 90.15% US SHARE, 28+ REITs IN S&P 500
| North America Listed RE | US Share of N. America | US REIT Dividends 2024 | REITs in S&P 500 |
| USD 1.3 Trillion (EPRA Q2 2025 Total Markets Table) | 90.15% of North America REIT market (Mordor 2025) | USD 66.2B (listed) + USD 4.3B (non-listed) Nareit | 28+ REITs as S&P 500 constituents (Nareit) |
North America is the world's dominant REIT market by equity market capitalisation, liquidity, and institutional depth, with the United States hosting more than 190 public REITs listed on major exchanges, 28 or more S&P 500 REIT constituents, and 170 million Americans approximately 50% of the US population invested in REITs through retirement accounts and investment plans per Nareit. US REITs owned approximately 570,000 properties at the end of 2024, with data centres and retail assets showing the strongest year-on-year growth in property count per industry analysis, and public listed REITs paying approximately USD 66.2 billion in dividends in 2024 per Nareit's May 2025 fact sheet. Industrial REITs maintained the largest sector allocation in the North America REIT market in 2025 per NAREIT 2025 REIT Industry Fact Sheet, while residential REITs are forecast to expand at the fastest sector CAGR of 5.05% through 2031, with single-family rental platforms and multifamily operators capturing the sustained US housing affordability-driven rental demand that structural homeownership constraints are generating across demographic cohorts from millennials to baby boomers.
| Europe REIT Growth Since 2020 | FTSE EPRA Nareit Dev. Europe | European 2025 Total Return | Key Markets |
| +39% (Nareit global REIT analysis) | EUR 14.42B debt and equity raised Q2 2025 (EPRA) | 21% outperformed US 3% (Nareit Q4 2025 webinar) | UK, Germany, France, Netherlands, Sweden, Belgium |
European listed REITs and listed real estate delivered 21% total returns in 2025, outperforming the US market's 3% per Nareit's Q4 2025 review webinar, with some performance driven by the US dollar's decline against European currencies but with underlying European real estate fundamentals also contributing to the outperformance. Europe grew its REIT market capitalisation by 39% since 2020 per Nareit, with FTSE EPRA Nareit Developed Europe Index constituents raising EUR 14.42 billion in combined debt and equity in Q2 2025 alone per EPRA's Q2 2025 Total Markets Table, confirming that European REIT and listed real estate capital markets remained active even during the elevated rate environment. The United Kingdom, Germany, France, Netherlands, Sweden, and Belgium constitute the primary European REIT markets, with the Primary Health Properties-Assura merger creating a combined GBP 6 billion primary care REIT in the UK and Cellnex Telecom's European tower consolidation representing the breadth of specialist REIT sector development in Europe beyond traditional office and retail property.
ASIA PACIFIC ASIA 30% RETURN 2025, CHINA 58 REITs, INDIA +68% SINCE 2020
| Asia Total Return 2025 | China Listed REITs 2024 | India REIT Market Cap Growth | APAC Listed RE |
| 30% highest global region (Nareit Q4 2025) | 58 (up from 29 in 2023, from zero in 2021) | +68% since 2020 (Nareit) | USD 625 Billion (EPRA Q2 2025 Total Markets Table) |
Asia Pacific delivered 30% total returns in 2025, the highest of any global REIT region per Nareit's Q4 2025 review, with the EPRA Q2 2025 Total Markets Table confirming that the total value of listed real estate in the Asia Pacific region is approximately USD 625 billion of which 83.9% is represented in the FTSE EPRA Nareit Asia Pacific Index. China's REIT market, officially established in 2021, expanded from 29 to 58 listed REITs in 2024 alone per Nareit global analysis, driven by the Chinese government's expanded infrastructure REIT programme that includes logistics parks, clean energy, and affordable housing REITs alongside the traditional public infrastructure focus. Japan's J-REIT market constitutes the oldest and most mature REIT market in Asia, with the J-REIT structure established in 2001 and the Japanese market now representing the largest single REIT market in Asia by combined market capitalisation, with Parkway Life REIT and Mapletree Industrial Trust representing Singapore's globally recognised REIT market and Australia's A-REIT cluster providing the third major APAC REIT concentration.
MAJOR COMPANIES
STRATEGIC DEVELOPMENTS
Ordered 2026 first. All developments sourced from verified FTSE EPRA Nareit data, Nareit official publications, company SEC filings, and verified trade press.