| TROVIEW INTELLIGENCE | Global Office Real Estate Market | Q2 2026 | TRV-OF-001-GLB |
By Property Grade · By Business Model · By Occupier Sector · By Region
Flight-to-quality consolidation lifts Grade A vacancy to decade lows while over 400 million square feet of Class B and C stock drifts toward functional obsolescence the global office market is bifurcating at a speed that mid-cycle capital allocation strategies were never designed to manage.
| 01 MARKET SYNOPSIS |
MARKET SYNOPSIS
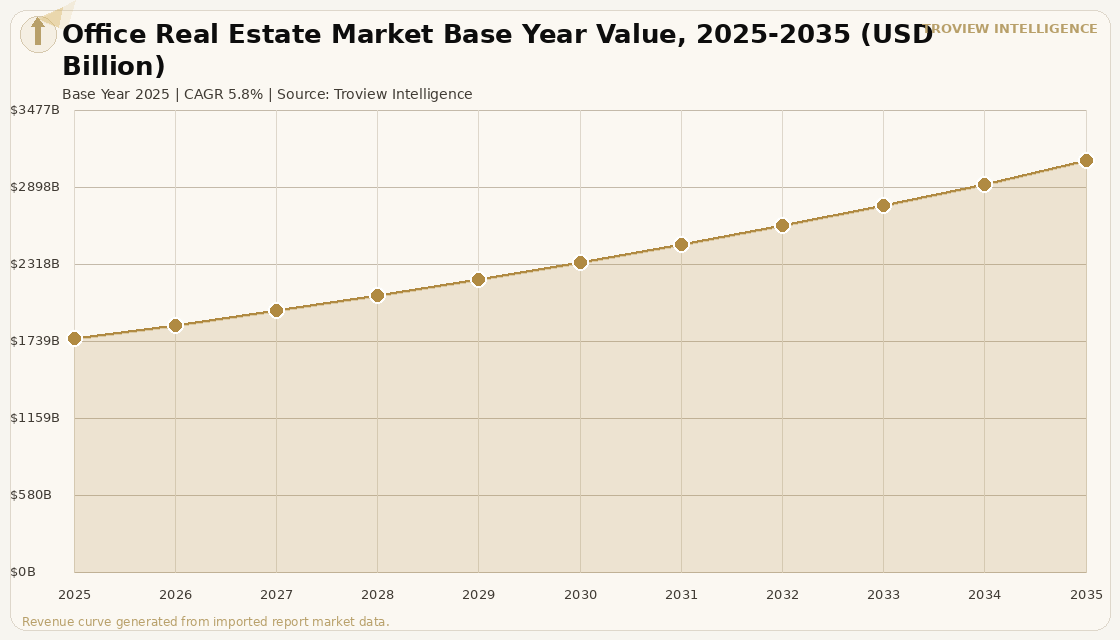
The global office real estate market size was USD 1,762.40 Billion in 2025 and is expected to register a revenue CAGR of 5.8% during the forecast period, reaching USD 3,104.58 Billion by 2035. Market revenue growth is supported by a structural shift in occupier strategy toward flight-to-quality consolidation, with corporations downsizing absolute footprint while upgrading asset specification to attract employees back to the office and meet internal sustainability mandates. JLL's full-year 2025 global real estate data confirmed that global office leasing reached its highest annual volume since the pandemic, driven by large occupiers executing strategic relocations from secondary assets into Grade A buildings in gateway submarkets including Manhattan, London, Tokyo, and Bengaluru. CBRE's Q1 2026 US office report recorded US office leasing activity up 7.6% relative to Q1 2025 and net absorption positive for the third consecutive quarter, with San Francisco adding 1.6 million square feet and New York 1.5 million square feet of quarterly occupancy gains. The Global Capability Centre expansion cycle, which JLL confirmed delivered 31 million square feet of GCC-related leasing in India alone during 2025, is creating durable long-dated office demand in Asia Pacific markets at a pace that no other occupier segment can match. For instance, in January 2026, Keppel REIT, Singapore, acquired a 50% interest in a Grade A office building in the Marina Bay submarket for SGD 780 Million from a private fund managed by PGIM Real Estate, with the building operating at 98% occupancy on long-term leases to financial services tenants, reflecting the scale of institutional conviction in premium Asian office assets. These are some of the key factors driving revenue growth of the market.
North America retained approximately 28.9% of global office real estate revenue in 2025, anchored by trophy asset performance in New York, where prime office rents grew 2.2% year-on-year in Q1 2026 according to JLL data, and Miami, where same-asset rents expanded by 4.0%. CBRE confirmed that US commercial real estate investment surged 29% in Q4 2025 to USD 171.6 Billion, with improving loan-to-value ratios for permanent office loans rising to 61.4% in Q1 2026 from 58.4% in Q4 2025, reflecting expanding lender appetite for high-quality assets. Asia Pacific recorded the strongest investment volume growth of any region in Q1 2026, with direct transaction volumes rising 31% year-on-year according to JLL's May 2026 global report, led by Japan and Singapore. The Grade A office segment held approximately 56.9% of global office market revenue in 2025 as flight-to-quality relocation consolidated occupier demand into premium buildings, leaving Grade B and Grade C stock across US markets at vacancy rates exceeding 25% in cities such as Dallas and Houston. Global direct real estate transaction volumes reached USD 216 Billion in Q1 2026, rising 18% year-on-year, with cross-border investment up 37% year-on-year to USD 55 Billion according to JLL, confirming that institutional capital allocation into office has resumed at scale in markets where supply is constrained and tenant quality is demonstrable. The rental model captured approximately 68.2% of global office market revenue in 2025 as corporations prioritised off-balance-sheet flexibility and continuous rightsizing capability over outright ownership of office assets.
However, the global office real estate market faces constraints from the Iran-US geopolitical tensions and the resulting energy price volatility through the Strait of Hormuz, which handles approximately 20% of global seaborne LNG and whose disruption has pushed upward pressure on inflation in energy-import-dependent economies including Japan, South Korea, and Western Europe, slowing the pace of interest rate reductions that had been expected to further unlock investment activity in 2026. The US office market carries delinquency rates on CMBS office debt that rose to 11.41% by March 2026 according to JLL, with approximately USD 929 Billion of CMBS debt approaching maturity and threatening leveraged owners of mid-tier assets with forced sales that widen the quality divide and depress blended market pricing. Suburban and decentralised business parks globally maintain vacancy rates in excess of 21% as hybrid working patterns structurally reduce the daily peak occupancy of cost-driven suburban office users, limiting rental growth in that segment and creating write-down pressure for owners of older non-refurbished suburban stock. Class B and C office inventory conversion costs to residential or life sciences use remain elevated given construction material inflation, meaning obsolete stock is slow to exit the market and continues to distort headline vacancy statistics in affected cities. These factors substantially limit global office real estate market growth over the forecast period.
The global office market in 2026 is not a uniform recovery story. It is a story of extreme bifurcation. Grade A buildings in gateway submarkets are operating at vacancy levels not seen since 2007. The buildings next door same city, same street sometimes are at 30% vacant and falling. The capital that came back into office in 2024 and 2025 was not betting on a general market recovery. It was underwriting specific assets with specific tenant covenants in specific locations where new supply is structurally impossible. That is a fundamentally different investment thesis from the one that drove the last office cycle. Investors who understand that distinction are finding some of the best risk-adjusted returns in commercial real estate right now. Investors who do not are still trying to work out what happened to their 2019 valuations." Troview Intelligence Head of Global Office Research
| 02 SEGMENT INSIGHTS |
SEGMENT INSIGHTS
| 03 REGIONAL ANALYSIS |
REGIONAL ANALYSIS
North America accounted for the largest revenue share of approximately 28.9% in the global office real estate market in 2025. Asia Pacific is expected to register the fastest regional CAGR through 2035, anchored by GCC expansion in India, supply-constrained premium markets in Tokyo and Singapore, and infrastructure-led office development in emerging South and Southeast Asian cities.
| North America | LARGEST MARKET BY REVENUE SHARE | ||
| Revenue Share 2025 | US Investment Growth Q4 2025 | Q1 2026 Net Absorption | Prime Rent Growth (New York) |
| ~28.9% | +29% YoY | +3.5M sq ft | +2.2% YoY |
North America retained approximately 28.9% of global office real estate revenue in 2025, anchored by the institutional depth and transaction liquidity of the US market. CBRE confirmed that US commercial real estate investment surged 29% in Q4 2025 to USD 171.6 Billion, with office investment volume expected to increase by 20% in 2026 as loan-to-value ratios for permanent office loans improved and lender appetite for high-quality assets expanded. The US market demonstrates extreme bifurcation, with JLL recording Q1 2026 net absorption positive at 3.5 million square feet as prime assets in New York and San Francisco absorbed occupier demand while the total inventory declined by 9 million square feet from market peak. New York recorded prime office rent growth of 2.2% year-on-year and Miami expanded same-asset rents by 4.0%, driven by financial services and legal sector demand for trophy space. US Sunbelt metros including Austin, Miami, and Nashville attracted corporate relocations through lower-cost operating environments and GCC satellite facilities. Canada's Toronto and Vancouver corridors contribute stable leasing volumes from technology and financial services occupiers, though elevated construction costs limit new supply. The Iran-US geopolitical tensions are creating energy cost uncertainty for building operators and occupiers with significant utilities exposure, particularly in energy-intensive data centre-adjacent office campuses.
| Europe | STABLE CORE WITH SELECTIVE RECOVERY | ||
| Cross-Border Investment Q1 2026 | Q1 2026 EMEA Transactions | Paris/London Grade A Vacancy | ESG Retrofit Pressure |
| +37% YoY | Led by UK & Germany | Sub-5% prime | High EPC mandates |
The market in Europe is expected to register steady revenue growth over the forecast period, anchored by tight Grade A vacancy in London and Paris where prime submarkets operate below 5% availability, and by structural retrofit demand driven by EU Energy Performance of Buildings Directive compliance requirements that are accelerating functional obsolescence in unrefurbished stock. JLL's Q1 2026 global data confirmed that EMEA cross-border investment finished Q1 2026 up 37% year-on-year globally, with the UK and Germany leading liquidity in the region and Spain, Poland, the Netherlands, and Portugal demonstrating notable growth. London's City and West End submarkets maintain occupier demand from global financial institutions and technology firms reinserting in-office policy requirements, with Canary Wharf facing continued structural pressure from HSBC and Barclays anchor tenant reductions offset by technology and media occupier inflows. Germany's office markets in Munich, Frankfurt, and Berlin carry supply pipelines constrained by elevated construction costs, supporting rental growth in Grade A assets near public transit. The Iran-US tensions are generating energy price volatility that is feeding through to European building operating costs and slowing some occupiers' relocation decisions pending geopolitical clarity, with Germany's industrial energy-linked office demand in manufacturing-adjacent cities particularly exposed.
| Asia Pacific | FASTEST CAGR REGION TO 2035 | ||
| APAC Investment Q4 2025 | Q1 2026 APAC Inv. Growth | India Gross Leasing 2025 | Singapore CBD Grade A Vacancy Q1 2026 |
| +35% YoY | +31% YoY | 83.3M sq ft record | 4.1% |
The market in Asia Pacific is expected to register the fastest regional growth over the forecast period, with JLL confirming Asia Pacific office investment reached USD 18.8 Billion in Q4 2025, rising 35% year-on-year, and APAC direct transaction volumes growing 31% year-on-year in Q1 2026. India's office market recorded gross leasing of 83.3 million square feet in 2025, the highest annual total ever recorded according to JLL, with GCCs capturing 37.7% of total leasing at 31 million square feet, driven by Bengaluru, Hyderabad, Pune, and Mumbai setting individual city records. CBRE's Q1 2026 Asia Pacific report confirmed that India's office market momentum has carried into early 2026 with vacancy declining to 15.2% in Q4 2025, the lowest in five years. Singapore's CBD Grade A vacancy fell to 4.1% in Q1 2026 as Marina Bay recorded vacancy declining from 9.4% in Q3 2024 to 4.2% in Q4 2025, with investment volumes surging 104.9% quarter-on-quarter to USD 19.7 Billion. Tokyo maintains chronically low vacancy through undersupply and in-office mandate compliance by Japanese corporations, with prime rents rising 10% year-on-year in Central Wards according to CBRE. The Iran-US conflict and Strait of Hormuz LNG disruption risk is particularly relevant for Japan and South Korea, both of which are among the world's largest LNG importers, creating building energy cost pressure and inflation that may moderate the pace of monetary easing and restrain occupier expansion decisions.
| Latin America | NEARSHORING DEMAND DRIVER | ||
| Mexico City Grade A Vacancy | Key GCC Markets | Lease Currency | Key Demand Driver |
| Declining nearshoring | Mexico City, Monterrey | USD-pegged dominant | US manufacturing relocation |
The market in Latin America is expected to register steady growth over the forecast period, led by Mexico City and Monterrey where US nearshoring strategies are driving demand for bilingual, dollar-pegged office leases from manufacturing sector GCCs and technology outsourcing firms relocating capacity from Asia. The US-Mexico USMCA trade framework supports continued nearshoring momentum as American corporations prioritise supply chain proximity and lower political risk relative to Asian alternatives. Brazil's Sao Paulo Faria Lima corridor maintains South America's strongest Grade A office market, with Brazilian technology firms, financial services companies, and multinational consumer brands competing for limited premium inventory. Bogota and Santiago are attracting smaller-scale GCC satellite demand from North American firms expanding their Latin American capability footprint. The impact of Iran-US geopolitical tensions on Latin American office markets is indirect, operating primarily through oil price dynamics that affect Brazil's energy-linked industrial activity and Mexico's manufacturing competitiveness.
| Middle East & Africa | FASTEST EMERGING MARKET CAGR | ||
| Dubai Grade A Vacancy | Saudi NEOM / Vision 2030 | South Africa Premium Demand | Regional CAGR Forecast |
| Below 8% DIFC, ADGM | Active supply pipeline | Sandton CBD recovery | Above-market pace |
The market in Middle East and Africa is expected to register an above-average CAGR over the forecast period, led by the UAE and Saudi Arabia where government-directed economic diversification programmes are generating structural commercial office demand at a scale not seen in either market during any previous decade. Dubai's DIFC and ADGM financial free zones maintain Grade A vacancy below 8% as regional headquarters of global banks, asset managers, insurance firms, and technology companies expand staffing to serve Gulf and Indian Ocean market growth. Saudi Arabia's Vision 2030 programme is creating new corporate office demand in Riyadh, Jeddah, and NEOM as foreign firms responding to MISA licensing requirements establish legal entities and physical operations in the Kingdom. South Africa's Sandton CBD in Johannesburg is recovering office demand from financial services and legal sector occupiers following pandemic-era contraction, though load-shedding infrastructure constraints continue to add operational cost uncertainty for office occupiers. The Iran-US conflict and resultant energy price volatility is a dual-impact factor for Middle Eastern office markets: elevated oil prices support Gulf government fiscal capacity to fund infrastructure and office development pipelines, while simultaneously creating inflationary pressure that increases construction costs and delays project timelines.
| 04 MAJOR COMPANIES |